AKKORD: Integration and visualization through modular data analysis
- 2021

New results in the current work report of the "Analysis Modules and Configuration" research area of the AKKORD research project are presented. A module for the customizable, automated generation of analysis dashboards was developed.
The research project AKKORD is divided into research areas in which the objectives of the project are developed. A summary overview of the four research areas in AKKORD can be found here. The objective of the research area "Analysis modules and configuration" is the development and implementation of partial solutions of the reference toolkit for value-creating, competence-oriented collaboration in value creation networks. This report describes the work status of the development of a module for the customizable, automated generation of analysis dashboards.
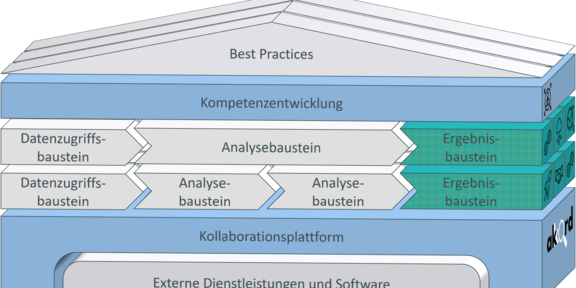
In the entire research project, the creation and application of modular modules for the practical implementation of Industrial Data Science projects is pursued. According to the reference toolkit, three types of modules will be developed for this purpose:
- Data access modules
- Analysis modules
- Result modules
Data access modules fulfill tasks for data connection and ensure consistent, efficient access to the necessary analysis data. Preconfigurable analysis modules provide the modular implementations for industrial data analyses, which means that only company-specific parameters need to be adapted. Result modules prepare the results of the analysis modules and make them available to end users in a meaningful form.
For the development of the result modules, the possibilities for linking to the analysis modules in particular are taken into account and coordinated. This will provide support for the efficient implementation of analysis modules in industrial processes. In this way, barriers to the use of data analysis technology are to be lowered, particularly for non-research-intensive small and medium-sized enterprises (SMEs).
The analysis dashboards are based on dashboard templates with slots for visualization modules. These templates are based on a user survey of existing needs and dashboards already in use. The visualization modules fulfill the following functions:
- Data selection: Alternative connection of available data sources. Predefined data sources can be replaced temporarily or permanently by the Dashboard User.
- User input: restriction of the considered data range and selection of high-level analysis parameters.
- Prediction summary: Aggregated assessment of the displayed data set and its prediction (e.g. a KPI).
- Graphical visualization: display of plots or graphs.
- Tabular representation: representation of a data set by tables, typically the visualized data set.
The automated dashboard creation and the presented user support functions prepare the work on the user-oriented configuration assistant.
This assistant is intended to provide solutions for user-oriented and application-specific creation of analysis processes. With the completion of the work in the performance area at the end of the year, the analysis processes will be unified with the dashboard creation.
Further information on the topic can be found in the original report. The work status is explained here by a video. Further background information on the work status of the AKKORD research project is added in publications and news articles.


![[Translate to English:] [Translate to English:]](/storages/zentraler_bilderpool/_processed_/3/3/csm_Maschinenbau-I_1a71b377c4.jpg)